(This article has been updated from the original and the 2022 version to include data covering our current students.)
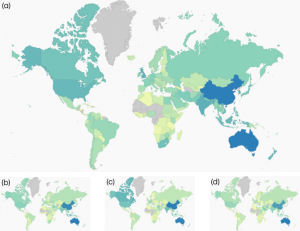
Our students come from a variety of countries, backgrounds, and life experiences. The University of Sydney is committed through its visions and values to cultivating a teaching and learning environment which is stronger because of the diversity of our students’ backgrounds, approaches to learning and unique perspectives. Our shared educational philosophy commits us all to build “a diverse, inclusive and intellectually exciting environment” for students. The aspirations of the 2032 Strategy takes this further with commitments to a “student-focused education” that “is transformational” and that “by 2032 our community will be more diverse and inclusive”. So what does our student cohort look like? Are our undergraduates all recent school leavers and studying full time? Which countries do our international students come from? Does our student body reflect the diversity of learners and backgrounds of our city, our state and region? Are equity students the first in their families to attend university? Are all first in family students from disadvantaged backgrounds?
After the years of seeing students primarily on our screens, it’s wonderful to see our campuses alive with the rich complexities and diversity of our unique student community. In this article, we present a “snapshot of student diversity” at the University of Sydney based on the students enrolled at the end of 2023 and offer some practical tips on how can we can embrace diversity in our classes by getting to know our students and ensuring all feel connected, valued and part of our University. The data presented below covers the whole University. You can find equivalent data for each of our faculties and University schools in the updated appendix.
Student diversity at the University of Sydney

As we look at a snapshot of the student diversity at Sydney, it’s worth also thinking about what we mean when we consider diversity.
What makes our students diverse is in itself, well, extremely diverse. There are the slightly more obvious things, such as country of origin, residency status (international or local), gender (female/male/X), age, attendance type (full-time (FT) vs part-time (PT) study load), course type (undergraduate (UG), postgraduate (PG) by course work, Higher Degree by Research (HDR)), state residency (NSW vs other), high school types students attended.
However, diversity can also manifest in other ways, such as our students’:
- values, beliefs, attitudes, expectations, and behaviours,
- worldviews and cultural lenses, and
- pre-tertiary educational systems, pedagogies, ways of learning.
Students can also come from a variety of different backgrounds, such as equity backgrounds. These cohorts include students from low socio-economic (low-SES), regional/remote/rural, Aboriginal and Torres Strait Islander (ATSI), disability, first-in-family (FIF), non-English speaking backgrounds (NESB), refugee and asylum-seeker, mature-age, migrant or first-generation, and educationally disadvantaged backgrounds. Definitions of these and other categories are available below.
Diversity can, therefore, be visible and/or invisible, and often intersecting – we are never just one thing.
A snapshot of student diversity in 2023
At a glance, at the end of semester 2, 2023:
- 41% of the undergraduate cohort are international students (an increase of 2% from 2022)
- 35% of enrolments are from non-English speaking backgrounds
- Around 12% of students identify as living with a disability
- 55% of our undergraduate students are female, compared to 59% and 51% of our postgraduate coursework and research students respectively.
- ~3000 low-socioeconomic status students
- ~500 Aboriginal and Torres Strait Islander students
- The number of students who do not identify as male or female has doubled since 2021
- Around 71% of commencing undergraduate came directly from high school (a drop of 4% since 2022)


| Equity type | Total | Female : Male | UG: PG: HDR (%) |
|---|---|---|---|
| Low-SES | ~2900 | 59 : 41 | 74 : 21 : 5 |
| First Nations | ~490 | 62 ; 38 | 51 : 40 : 9 |
| Regional | ~2000 | 59 : 41 | 58 : 33 : 8 |
| Remote | ~60 | 61 : 39 | 49 : 44 : 7 |
| Disability | ~4500 | 65 : 34 | 64 : 26 : 10 |
| NESB | ~2000 | 57 : 43 | 64 : 26 : 10 |
| Total | ~80000 | 56 : 44 | 55 : 39 ; 6 |
Valuing diversity
Making universities more diverse places has a number of benefits, including (but not limited to):
- exposing students to diverse experiences and opinions,
- exploring different ways of thinking about and living in the world,
- challenging existing power dynamics,
- expanding learning opportunities and methods, and
- opportunities to experience different ways of knowing, being, and doing.
Practical tips for getting to know your diverse students
One of the best ways we can support and embrace diversity in our classes is by getting to know our students. By engaging with your student’s backgrounds, needs, learning preferences, and previous experiences, you demonstrate to your students that their voices and perspectives matter. You can get to know your students in a number of ways:
- Get a quick insight into your student cohort with the Knowing Your Students portal.
- Access the Student Diversity dashboard for visualisations on Sydney Student data on equity groups, including student outcome information (access, retention, participation, success and attainment).
- Pro tip: To access the Student Diversity dashboard, open the Insights Hub and select PowerBI. From your Power BI home, click Apps in the left menu and the Student Diversity dashboard should be in the list.
- Learn your students’ names – some students can go all the way through university without a single person learning their name!
- Pro-tip: you can use SRES to learn how to pronounce your student’s names
- Pro-tip: use ‘name tents‘ in classes to help everyone learn each other’s names
- Be aware of the correct language to use in different contexts – for example, some students will appreciate recognition of the correct use of pronouns.
- Pro-tip: you can now add your pronouns in Canvas
- Listen to student needs – for example, you may organize regular office-hours (or Zoom drop-ins for those off campus) every few weeks to talk through any problems they may be having.
- Pro-tip: some (many) students might not know what “office-hours” mean, so you may rename this to something that is accessible to all, for example, “chat with your tutor.”
- Use icebreaker activities that help you learn about your student’s prior experiences and circumstances, in addition to creating a welcoming and engaging learning environment.
- Build a sense of community using platforms like Padlet or Canvas discussion board and reinforce these connections by referencing them in class!
We also have a few Teaching@Sydney articles that cover practical tips for getting to know your students:
- Welcoming students with SRES
- Knowing your Students dashboard gets a facelift
- Start this semester off with SRES
- Online Communication: Scale, Scope and Simplicity in FASS1000
- Making relationship-rich experiences the heart of higher education
Definitions of some common terms
- Low socioeconomic status (Low SES) students: Socioeconomic status (SES) is assigned to students on the basis of the Statistical Area 1 (SA1) in which they reside. SA1s have a population of between 200 to 800 people, averaging around 400. All SA1 areas are ranked nationally using the Australian Bureau of Statistics’ (ABS) estimates of the Socio-Economic Index for Areas (SEIFA) — Index of Education and Occupation (IEO). This is calculated using census data (Australian Bureau of Statistics, 2015). Low SES students reside in SA1s with the lowest quartile (25%) of the Australian population in this ranking. The 2011 census is used to define SES between 2013 and 2015 and the 2016 census for 2016 to 2018. The Low SES measure reported is the current address (address during current year of study), but a comparison to the first address measure (address at time of enrolment) is also provided
- Aboriginal and Torres Strait Islander (ATSI) students: Students self-report as Indigenous to their higher education provider, either at the time of their enrolment or during their studies.
- Students from regional areas: Regional students are defined as having a permanent home address in an SA1 area that is classified as regional using the relevant Australian Statistical Geography Standard (ASGS) classification, with the 2011 ASGS used for the years 2012–15, and the 2016 ASGS thereafter. As is the case with the Low SES measure, the regional measure reported is the current address (address during current year of study), but a comparison to the first address measure (address at time of enrolment) is also provided.
- Students from remote areas: Remote students are defined as having a permanent home address in an SA1 area that is classified as remote using the ASGS and their current address (address during current year of study), with the first address measure (address at time of enrolment) also provided.
- Students with disability: Students self-report disability to their higher education provider, usually via a formal enrolment declaration.
- Students from a non-English speaking background (NESB): A student is assigned NESB status if they are a domestic undergraduate student who arrived in Australia less than 10 years prior to the year in which the data were collected, and who comes from a home where a language other than English is spoken.
Want to know more?
- Check out the Teaching@Sydney post A shared sense of place – empowering culturally responsive teaching which covers culturally responsive teaching strategies and using strengths-based approaches to leverage diversity in the classroom, such as activating students’ prior knowledge, making learning contextual and encouraging students to leverage their cultural capital, to make learning more welcoming.
- Purposefully include activities to help students develop a sense of belonging such as the powerful ‘My journey‘ activity to share each student’s unique educational and personal journey.
- The Modular Professional Learning Framework offers a number of modules that could assist in teaching diverse student cohorts. M20 Supporting diverse experiences in learning and teaching, M03 Inclusivity and diversity, and M08 Engaging students in lectures and large classes are just a few.
- For a snapshot of the diversity in each of our faculties and University schools, see the appendix.
- Data on students at school is available from the Australian Bureau of Statistics. Data on students taking the HSC in 2021 is available from the NSW government.
More reading
There is a large amount of important scholarship on the role of diversity in higher education. One of the seminal works is:
- Patricia Gurin, Eric Dey, Sylvia Hurtado & Gerald Gurin (2002) Diversity and Higher Education: Theory and Impact on Educational Outcomes. Harvard Educational Review, 72 (3): 330–367. doi: https://doi.org/10.17763/haer.72.3.01151786u134n051
Important work focussing on the Australian context includes:
- (2010), The impact of student experiences with diversity on developing graduate attributes, Studies in Higher Education, 35:5, 529-543, doi: 10.1080/03075070903222658
- (2013), University diversity and preparation for a global society: the role of diversity in shaping intergroup attitudes and civic outcomes, Studies in Higher Education, 38:4, 555-570, doi: 10.1080/03075079.2011.584971


2 Comments