
Students consistently say that they value their relationships with their teachers and their support and feedback. As we move into a COVID-normal teaching context, this year we’re seeing an increase in the use of a homegrown (and publicly-available) system that helps teachers use the right data data to improve engagement and relationships with students. Teachers across all of Sydney’s faculties and schools are increasingly using SRES for a variety of purposes, from tracking attendance to getting to know their students better to marking and giving feedback on assessments such as OSCEs (objective structured clinical examinations). Sometimes it’s tricky to know what is possible, so we thought we’d highlight four vignettes of simple, achievable, and, importantly, impactful approaches that can improve your students’ engagement and your relationship with them through data in the right place, at the right time.
Know and hear your students
There’s few things more thrilling (and terrifying) for educators than meeting your new class for the first time. Seeing their faces, learning their names (and getting pronunciation right), finding out more about their interests, connecting with them – these very human things drive many educators. What if there was a way to get a head start on this?
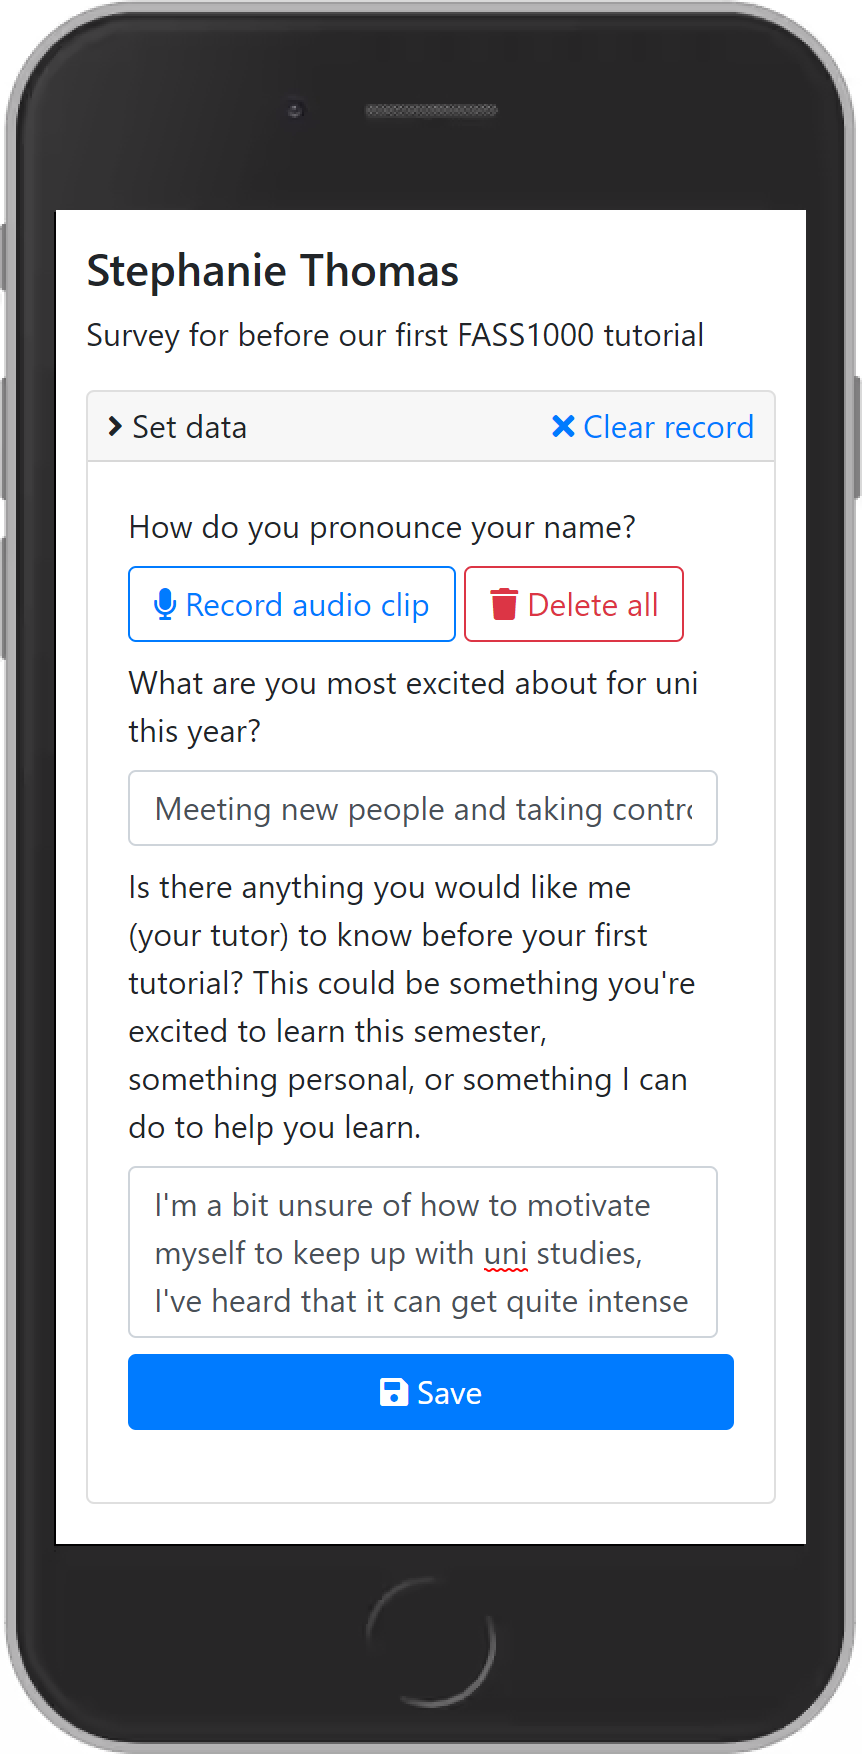
Alix Thoeming, one of the coordinators of the new FASS1000 unit for all first-year students in the Faculty of Arts and Social Sciences, has tutors send out a short ‘getting to know you’ survey before semester. The survey asks students to record a pronunciation of their name, what they are most excited about, and if there is anything else they’d like to share with their teachers.
[it’s] our way of showing our FASS1000 students that we care about them before they even step foot (physically or virtually) into the teaching space
This information is then given to tutors in an ‘electronic roll‘ where tutors can see students’ Canvas avatars, their engagement so far with Canvas, alongside name pronunciation and students’ interests to help tutors get to know their class. On the same screen, tutors can record student attendance/participation and save any notes for themselves or the coordinator.

Alix says that this “approach is our way of showing our FASS1000 students that we care about them before they even step foot (physically or virtually) into the teaching space. It’s a quiet, private conversation between the student and tutor, where they can share anything they feel we need to know about them.”
To do this, Alix set up a single ‘column’ inside SRES for the survey and made it available to students. She also synchronised relevant data from Canvas (engagement analytics, pronouns, and student avatars). Finally, she set up a weekly ‘roll’ column which displayed this information and allowed tutors to collect attendance data and other comments.
Help and support self-tracking of student progress
The start of semester involves getting used to new systems, new Canvas sites, new units, new approaches. Often this can be overwhelming and it’s easy for students (and indeed us) to lose track of what we need to be doing. Sometimes we just need a bit of guidance, or a few prompts, and maybe even a checklist, to help us stay on top of things. It also helps if there’s someone who cares about us nudging us along at key points. What if you could do this interactively for your students, right within Canvas?
SRES to-do lists gave me real insight into whether or not the students were on track but it also shifted the list from a passive reminder to an active learning support whereby students could tick off items on the list
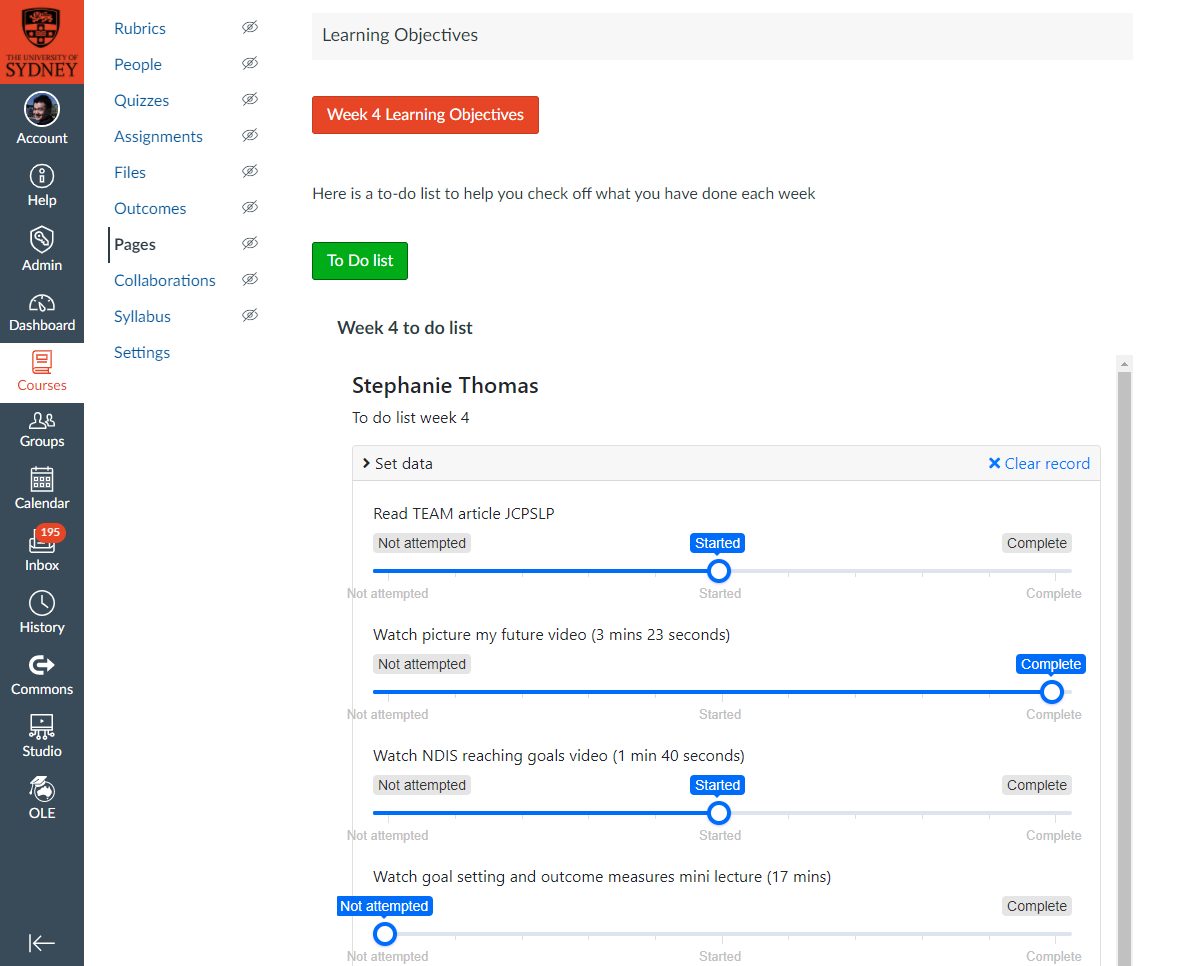
Andy Smidt coordinates CSCD3076, a unit in the Faculty of Medicine and Health that helps students learn how to support individuals with complex communication needs. She has an SRES-powered to-do list embedded into the Canvas page for each week, where students can self-monitor their progress against key activities that need to be completed each week. Andy and her teaching team can also easily follow up on students who seem to not be tracking well.
When she polled her students, they overwhelmingly said that keeping up with the to do list helps their learning and that Andy should definitely continue this practice. Andy says that “I used to do something like this with a weekly announcement on Canvas. Students reported that this was helpful in the USS feedback at the end of the semester but whilst the reminders were helpful for students, I couldn’t see whether or not the students were on track. The SRES to-do lists gave me real insight into whether or not the students were on track but it also shifted the list from a passive reminder to an active learning support whereby students could tick off items on the list. I also loved that SRES allowed the students to let me know that they valued this via the “was this helpful” feedback box right within the portal. One student replied that they appreciated my filter saying “it was a helpful reminder to make sure I have kept up with the pre-work requirements, especially to prepare for the marked quiz”.”
To do this, Andy set up a column inside SRES for each week’s to-do list and made it available to students in Canvas by embedding it as an ‘LTI tool’. She then uses SRES filters to personalise messages based on how students are reporting their progression states to provide tailored encouragement.
Seamlessly encourage regular reflection
When we’re building resources on Canvas, it’s often tricky to know how students are moving through them and what they’re thinking as they engage with what we’re putting online. There isn’t a seamless way of capturing students’ opinions and thoughts so that students can be encouraged to regularly reflect on their learning, and so that teachers can easily understand how the cohort is tracking and be able to identify and support students individually. Or is there…
SRES organises your data so that you can see trends both in how students engage with your online material and in how well they understand the course material
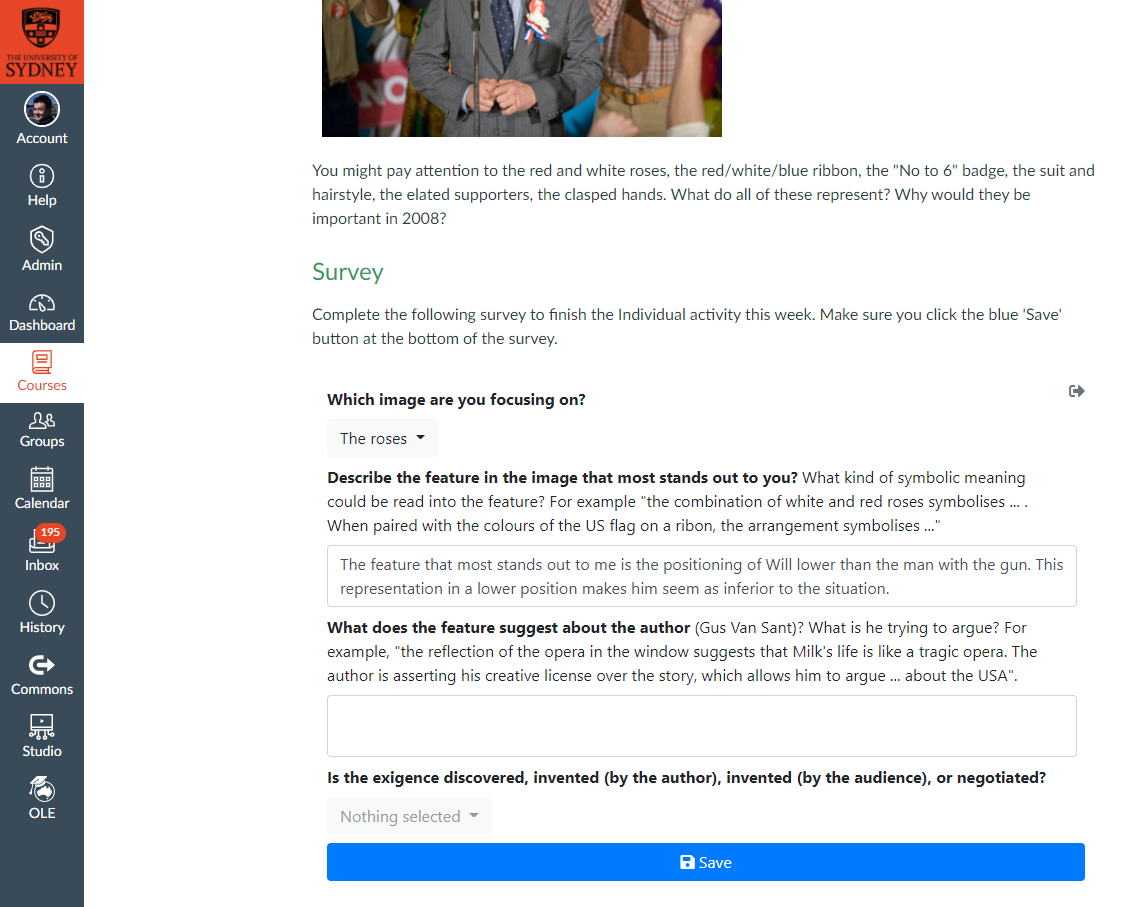
Ben Miller is the coordinator for WRIT1001, a large first-year unit in the Faculty of Arts and Social Sciences focussed on writing and rhetoric. COVID-19 has driven him to redesign a large portion of his unit material for asynchronous online delivery, through curated as well as specially-recorded videos, materials on Canvas pages, and discussion boards. He has designed weekly individual reflective activities that are simple prompts embedded into Canvas pages that ask students to critically apply their understanding. This data is immediately saved into Ben’s SRES database for WRIT1001, giving him a birds’ eye view of student engagement and understanding.
Ben says “SRES organises your data so that you can see trends both in how students engage with your online material and in how well they understand the course material. This gives teachers the chance to design relevant learning activities tailored to student needs and preferences.”
Closing the reflection loop
Helping students to develop their own ability to think about their learning and behaviour is one of the more powerful things we can do as teachers. Often it’s also important to revisit our perceptions and what others have fed back to us in the recent past and build upon these. These activities are usually completed in fillable documents that students download, or through prompts that don’t necessarily need students to provide any tangible input. What if there was a way to encourage students to reflect and help close the loop?
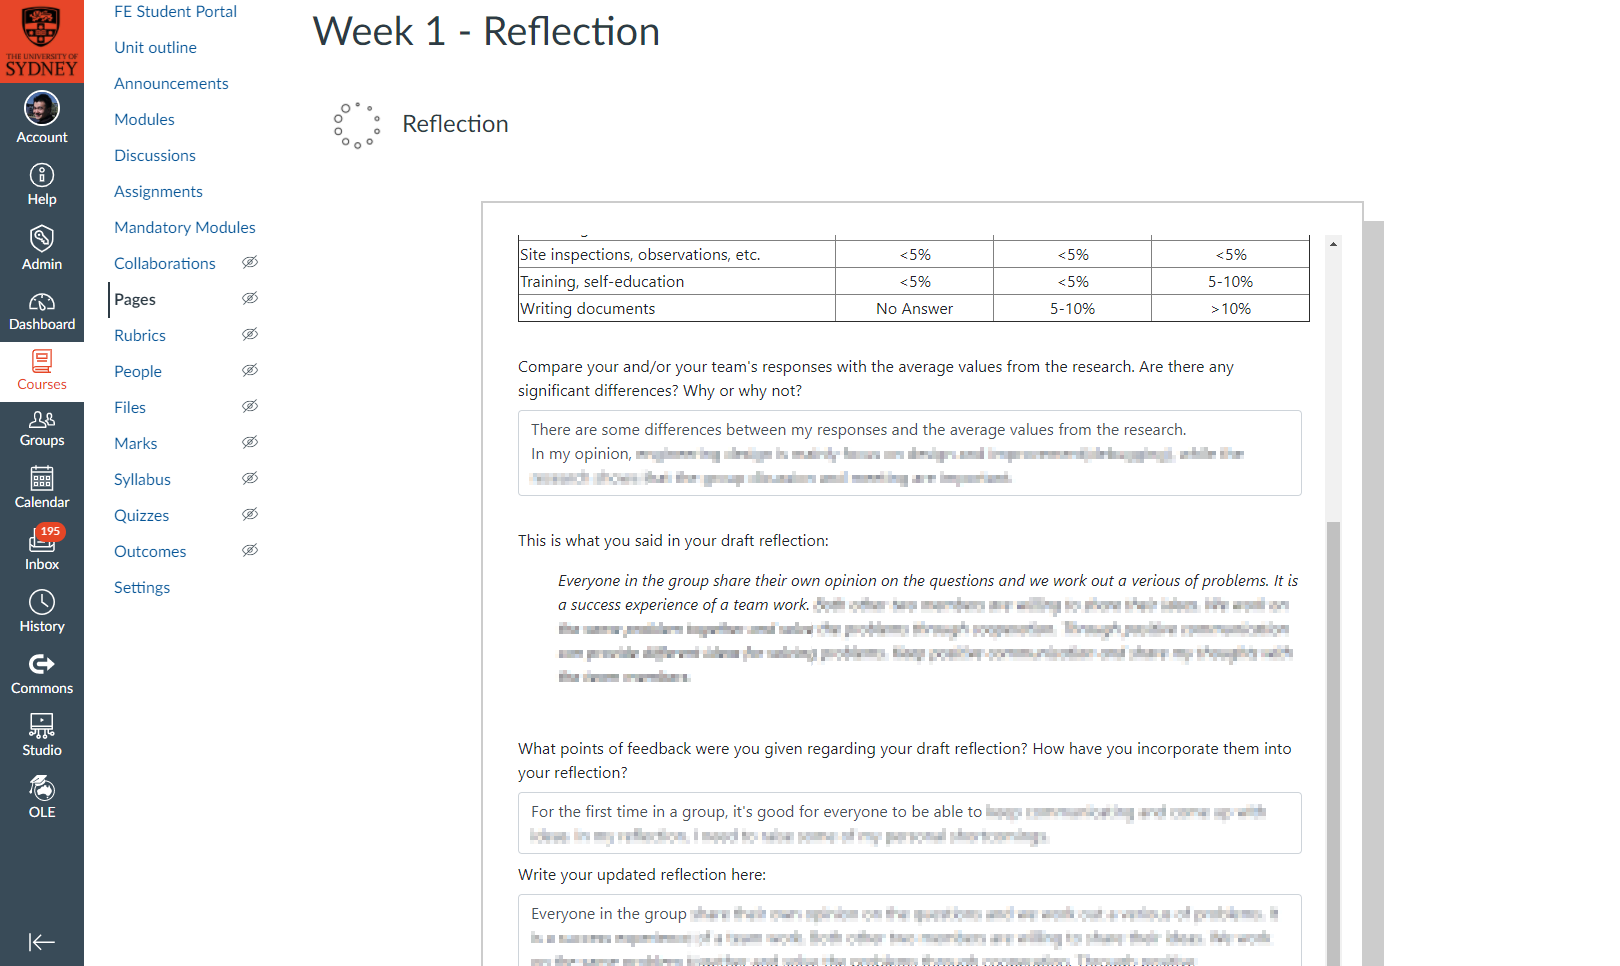
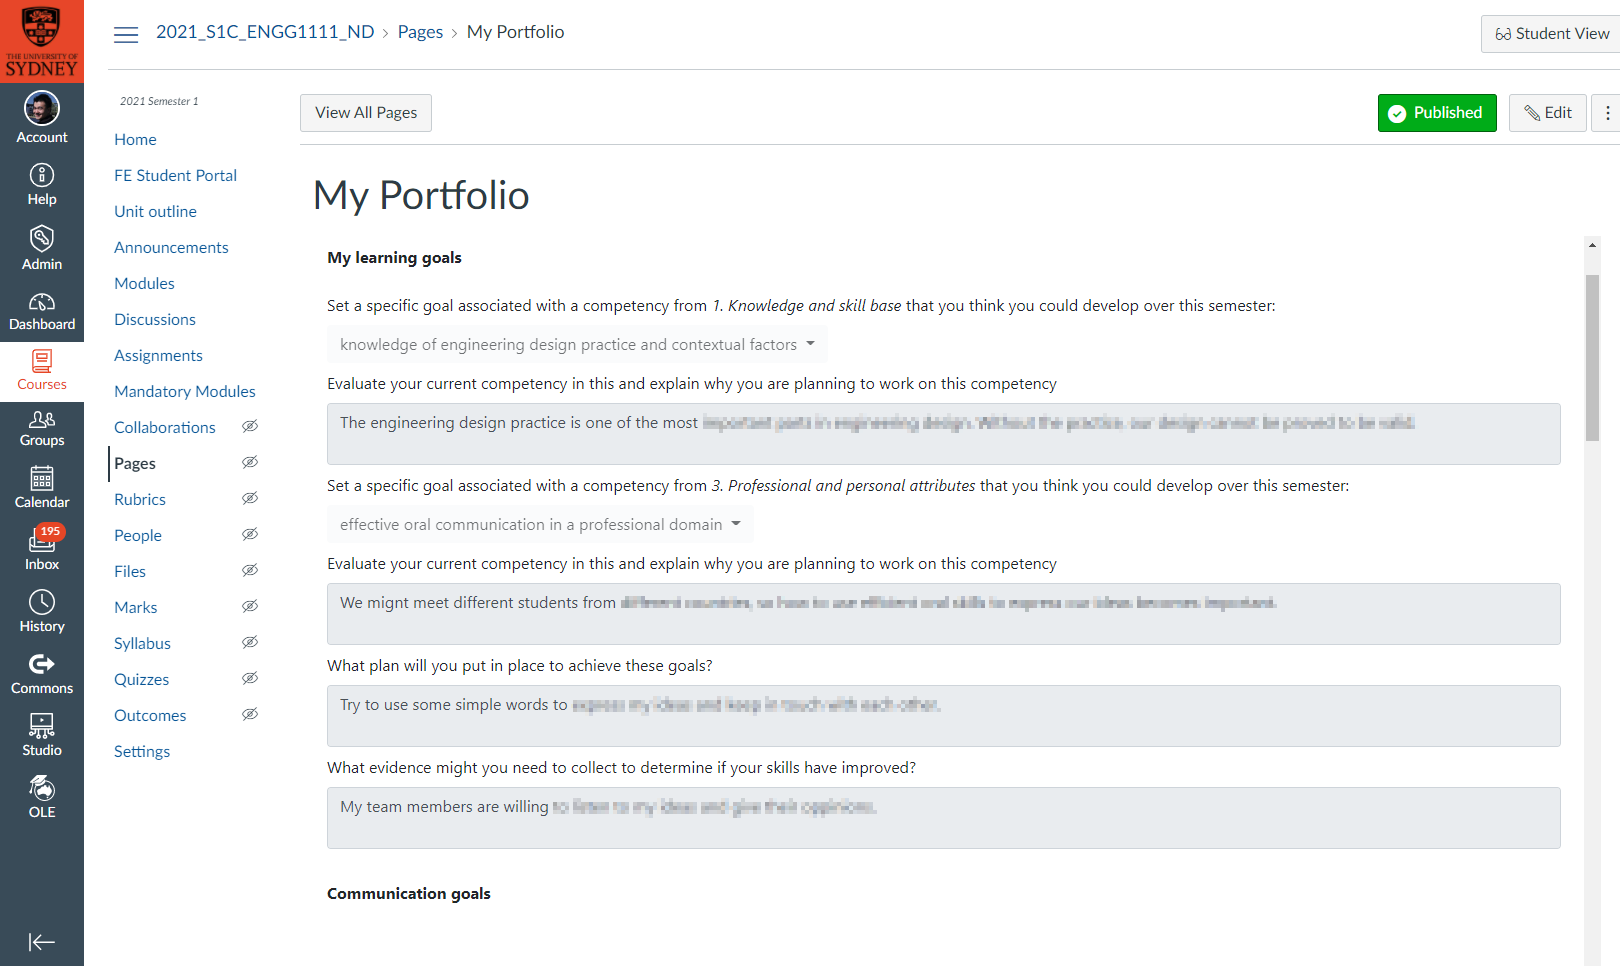
Guien Miao is the coordinator for ENGG1111, a large first-year unit in the Faculty of Engineering. The unit aims to equip students with a broad understanding of engineering practice and the skills to foster their ongoing personal and professional development. Guien has fillable reflective activities embedded into Canvas pages, and shows students their recent reflections and feedback together in one place adjacent to prompts for further reflection so that they can keep building upon this as part of their development. Students set their own goals and can track these and their reflections and progress towards their goals in a personalised portfolio.
The wealth of information that we have stored in SRES… helps us to better understand our students as individuals with different goals and interests…

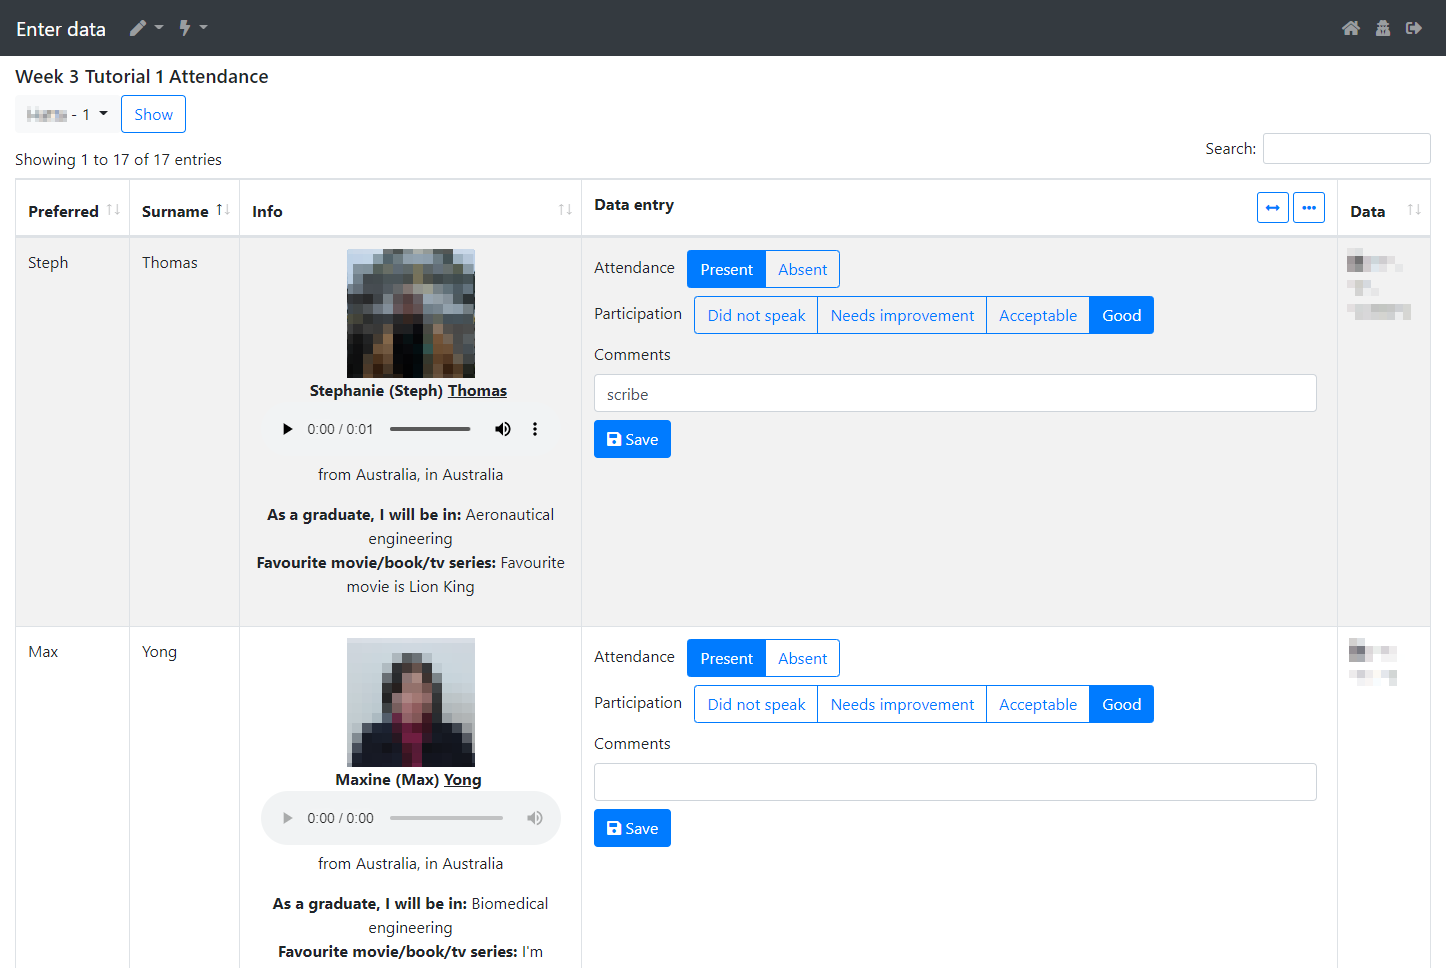
To help get to know and support their students better, tutors are given an ‘electronic roll’ that, similar to Alix’s use, where they can see students’ profile pictures, hear them pronouncing their name, get to know their favourite movie or TV show, where they’re heading to upon graduation, and where they are studying now. Alongside this, tutors can also record attendance, participation, and comments for themselves and their coordinator.
Guien says “my teaching team and I have a diverse cohort of students – some have already decided what they’ll be doing as a graduate engineer and others don’t want to be an engineer at all; some are in Sydney and others are spread all across the world. All of them come in with different experiences and will take away different learnings from ENGG1111, so we aim to create an environment that is flexible and leverages that diversity. The wealth of information that we have stored in SRES (from Sydney Student and student/tutor input) helps us to better understand our students as individuals with different goals and interests, as well as encourage and review their ongoing professional development.”
To do this, Guien set up a number of SRES columns that contained prompts and text boxes for students to enter their reflections. She then put these columns into SRES portals, allowed students to edit their own data, and also embedded other data (e.g. student responses to previous reflections) into the portal as well. The portals were then embedded into Canvas as an LTI tool, making it a seamless experience for students.
Connect students through relevant cohort data
Here’s a bonus one. Sometimes we’d like our students to contribute something to a pool of class information, such as thoughts on a discussion board, or data to share with others. Seeing input from other students can help students feel more like they are part of a whole. But what if a discussion board wasn’t quite the right avenue because the information was fairly simple and needed to be anonymised, or if you needed some sort of aggregate visualisation?
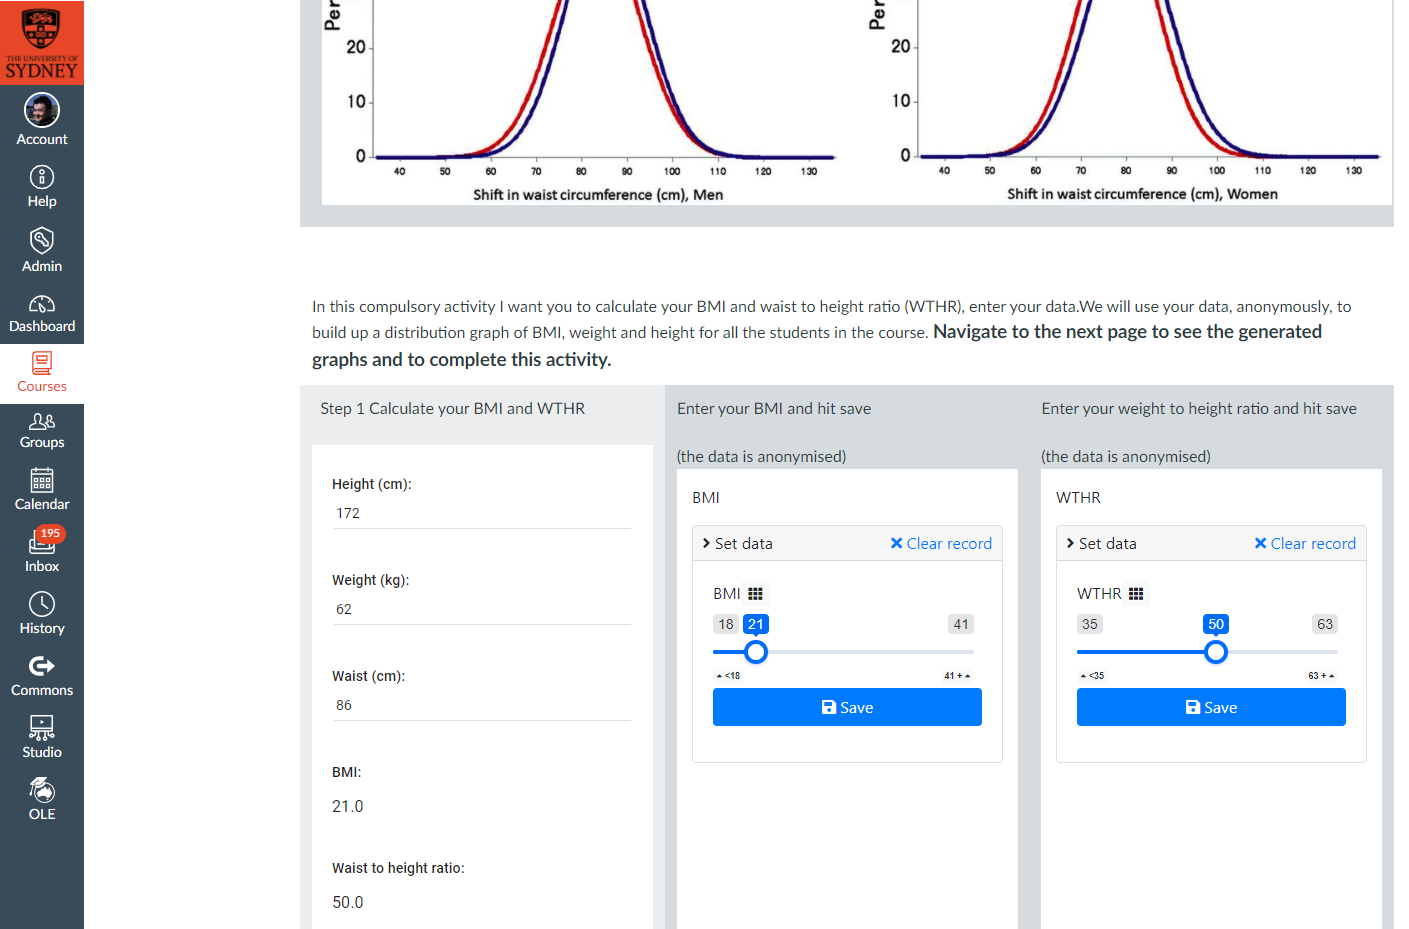
OLEO1503/OLET1504 is an Open Learning Environment unit from the Faculty of Medicine and Health which addresses health challenges surrounding diabetes. Peter Thorn (unit coordinator) and Rebecca Denham (educational designer) have built a two-part activity where students analyse collective class data and compare it to general health recommendations. These data are anonymously presented to students in aggregate so that they can analyse the collective class data and consider their own measurements against this.
students can see a representation of real data in real time, adding a new level of authenticity to the analysis task
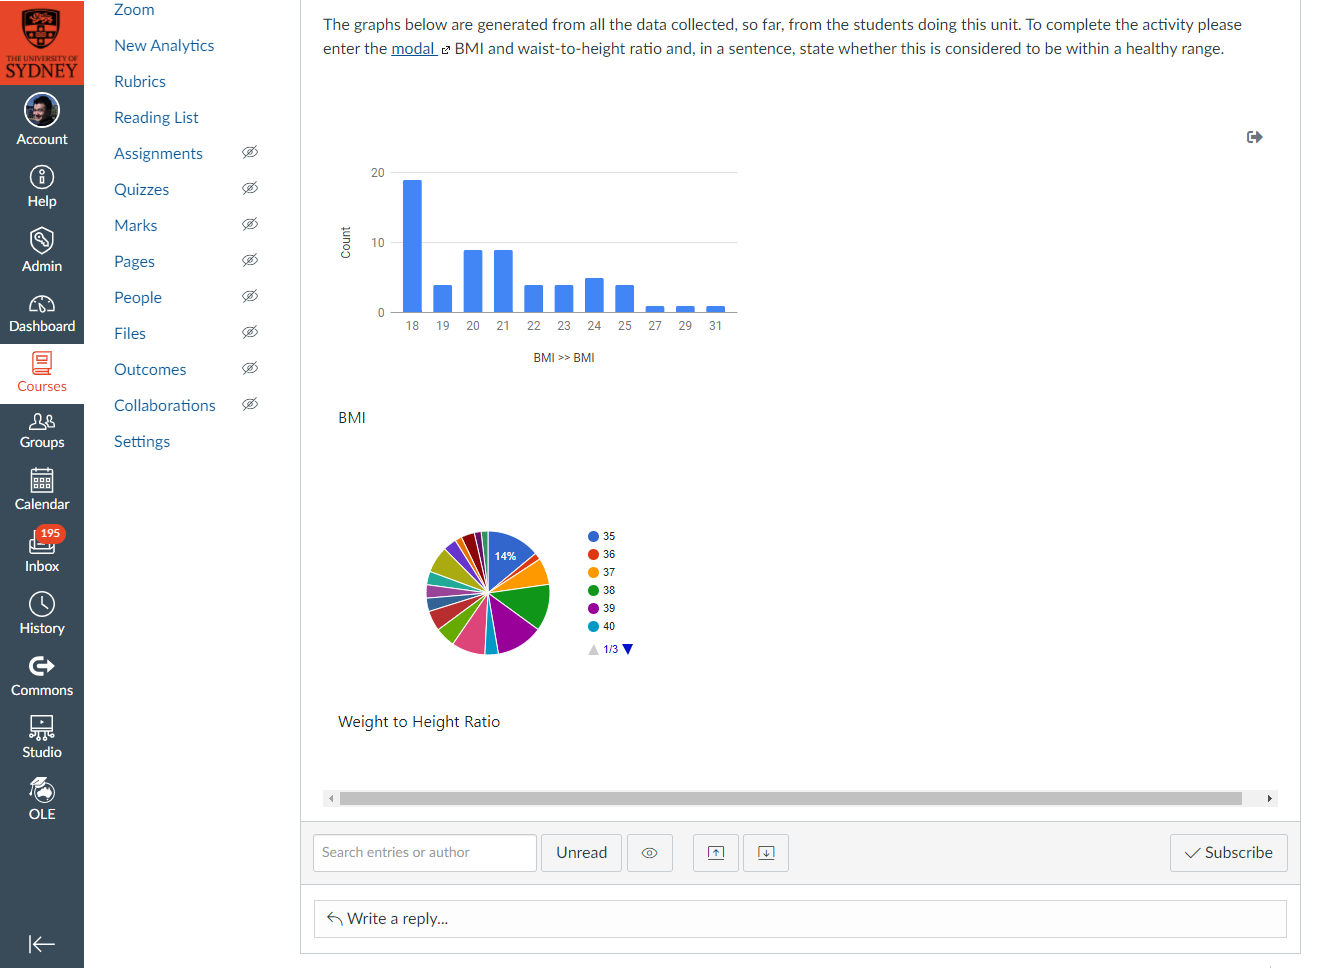
Becky says that “the new summaries feature means that students can see a representation of real data in real time, adding a new level of authenticity to the analysis task. I can’t wait to see other innovative uses of this easy to use but high impact tool”.
To do this, they built columns in SRES to display slider inputs to students, and embedded these columns into Canvas as an LTI tool. Students would enter data seamlessly via a Canvas page, which would be saved in SRES. They then used a relatively new SRES feature called ‘Summaries’ to present data visualisations of the data in the columns, and put these Summaries into SRES ‘portals’ that were then embedded into the description of a Canvas discussion.
Tell me more
- We’d love to hear how SRES is helping you build stronger relationships with your students and actively engage them. Please email [email protected] with your stories.
- SRES is available under a free licence to other institutions – get in touch to find out more. You don’t need to be using Canvas to use SRES, although SRES works well with Canvas.
- Sydney educators can book 30 minute online consultations with an educational designer to discuss how SRES might help you and your students. Technical enquiries can be emailed to [email protected].
- Fully-illustrated help guides are available that show you some nifty things for which SRES is used by other educators, along with step-by-step instructions on how to do these yourself.
- The introductory guide covers setting up SRES, collecting information from markers and students, and making ‘filters’ and ‘portals’ to provide personalised feedback and support to students.
- The comprehensive guide covers approaches to get to know your students better, using SRES to promote positive assessment and feedback practices including developing students’ ability to self-assess (‘evaluative judgement’), self and peer reflection and assessment, approaches to support experiential learning and participation, and manipulating data.


5 Comments