We’re all aware that assessment is a central part of Higher Education. It plays a fundamental part in shaping the experience of how and what students learn (Boud, 2010), and is expected to fulfil a multitude of functions (Boud, 2000). As a form of measurement, assessment is used to provide certification and quality assurance of learning for both internal and external stakeholders (Bloxham & Boyd, 2007). Formative assessment promotes and encourages student learning. In the assessment ‘for’ learning’ (AfL) approach, all assessment contributes to students’ productive learning (Sambell, McDowell, & Montgomery, 2012).
The issue of what constitutes ‘enough’ assessment is therefore underpinned by a number of contexts and a multitude of purposes, but in many tertiary institutions, it is a fundamentally linear process, with an imbalance towards summative, and often high stakes, assessment that does not encourage learning and offers few opportunities for AfL. Moreover, assessment often does not support the development of skills needed for an uncertain future such as collaboration, evaluative judgement and creativity. It also seems that many assessment practices don’t really take advantage of the digital environment or rely on artificial barriers to prevent students from utilising online tools. It can often feel that assessment is a burden on both students and teachers: a task that is painful to do, and painful to set up and mark.
What does the literature tell us about assessment load?
A study of assessment load across UK research-intensive universities by Tomas & Jessop (2019) showed that there is a correlation between perceived assessment load and how students approach learning. The authors defined assessment load across whole undergraduate degrees, according to four measures:
- volume of summative assessment;
- volume of formative assessment;
- proportion of examinations to coursework;
- number of different varieties of assessment.
In their study, they concluded that students struggle with assessment load and often need to juggle assessments. They found that more summative assessment, more examinations, and more variety in assessment run the risk of encouraging surface approaches to learning, where students are forced to deploy tactical strategies to cope with complex assessment loads. They suggest that the solution appears to lie in a shift to less summative assessment, fewer examinations and less assessment variety across whole programmes, in favour of more creative, meaningful and engaging formative tasks which help students to learn.
Assessment design needs to attend to the resurgence of the slow learning movement, encouraging students to engage in formative tasks for pleasure, for learning, and out of curiosity borne of scholarship and inquiry (Berg and Seeber 2016). The only way to take these radical steps is together, through a whole programme approach, and a climb down from the ‘assessment arms race’ (Harland et al. 2015).
Another study by Kember (2004) explored factors that affect students’ perceptions of workload, and also found that a high perceived workload led to more surface approaches to learning. There were similar findings in studies by Harland et al (2015) and
Harland & Wald (2021). Their research took place at Otago University, where they interviewed students and lecturers to
explore their experiences of assessments. They found that it was possible to experience hundreds of graded assessments in an academic year. Students tended to be very focussed on grades and would not work without them. These conditions contributed to competition for student attention and a ‘grading arms race’ between academics and subjects. This situation created little opportunity for fostering self-motivated learners and deep learning. Both students and lecturers were unsatisfied with this situation, but neither group could envisage radical change.
Assessment load at Sydney
Volume of assessment
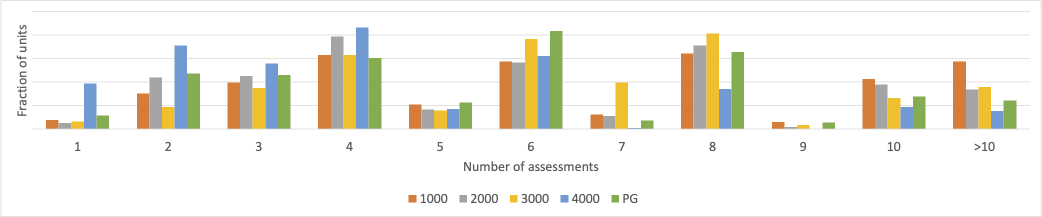
Assessment at the University of Sydney is complicated and comprehensive, with around 45000 individual assessments running in 2022 across around 6500 units. The median number of assessments is 4 for both undergraduate and postgraduate units but, as shown in Figure 1, the actual value spans from 1-22 and varies considerably across units.
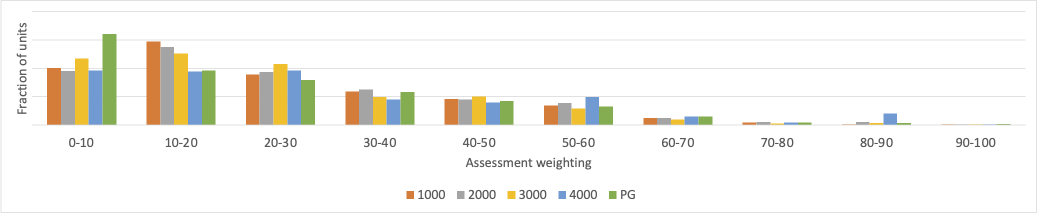
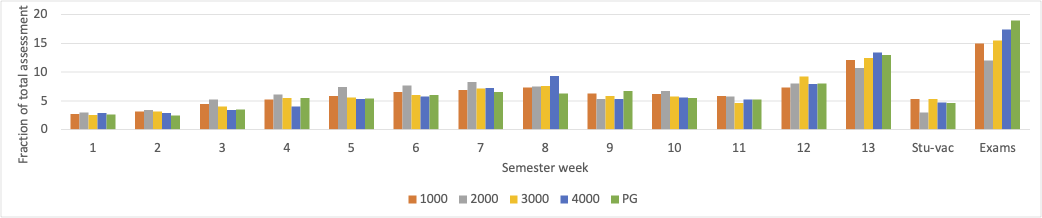
The median assessment weighting is 20% for levels of study but, as shown in Figure 2, this also varies hugely and spans 0.5% to 100%. Figure 3 shows the weighting of the assessment by the semester week. Although there is a distribution across all weeks for each level of study, the weighting of assessments in week 13 and in the exam period are the largest.
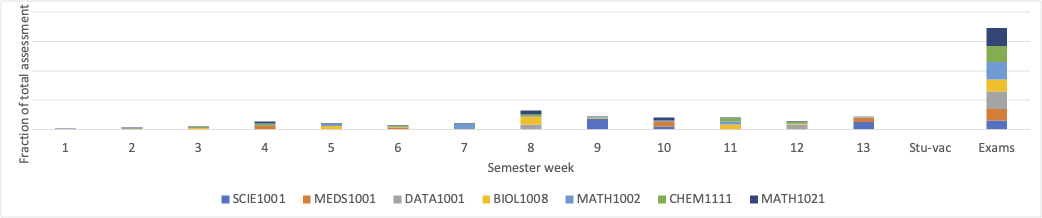
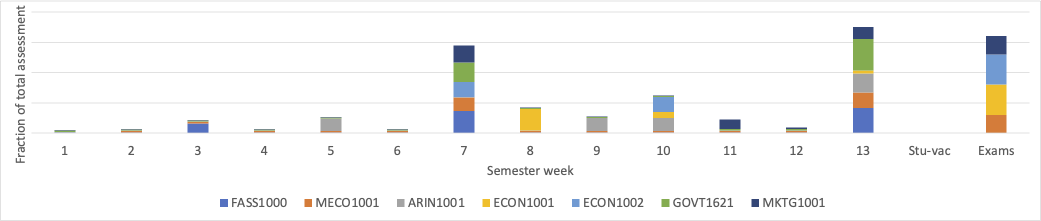
So what does this mean for a ‘typical’ student given the volume and variety of the units of study and pathways on offer? Figures 4, 5 and 6 show the assessment pattern by week for the BSc, BA and BCom respectively for the most commonly chosen first-year units.
Continuous and multiple-week assessments has been averaged out over the teaching weeks.
Continuous and multiple-week assessments have been averaged out over the teaching weeks.
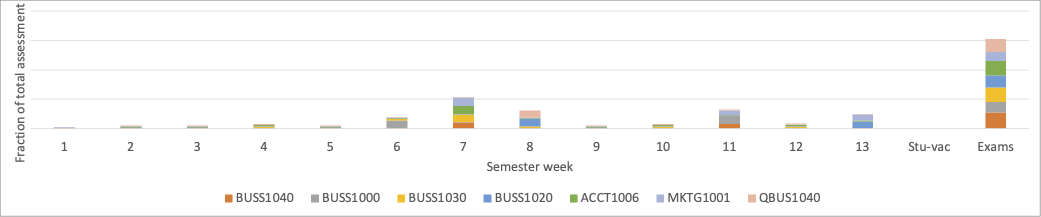
Continuous and multiple-week assessments have been averaged out over the teaching weeks.
In each of the three courses, there is generally some low-weighted assessment pre-census date – good practice, especially for first-year units. For BSc students, there is a heavy bias towards summative exams and this will no doubt influence the approach and engagement of students. The BA students have a number of deadlines in weeks 7 and 13 and this may lead to clashes and hence to associated stresses on students, staff and systems such as special consideration. The BCom sits in between. Figure 7 shows the assessment deadlines in more detail to show the load falls in week 13 and on Fridays and Sundays between 9 pm and midnight, with Friday of week 13 being around 3 times as busy as any other day. 23:59pm is by far the most common due time. Taken together, it is clear that students will have assessment deadlines falling very close together.
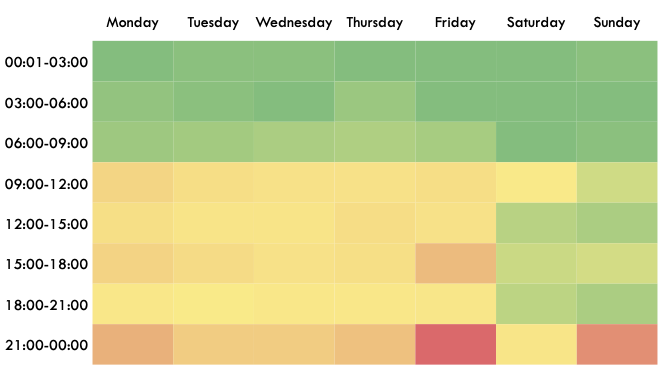
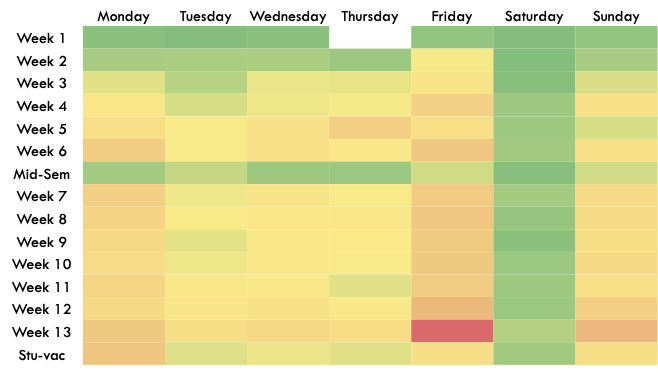
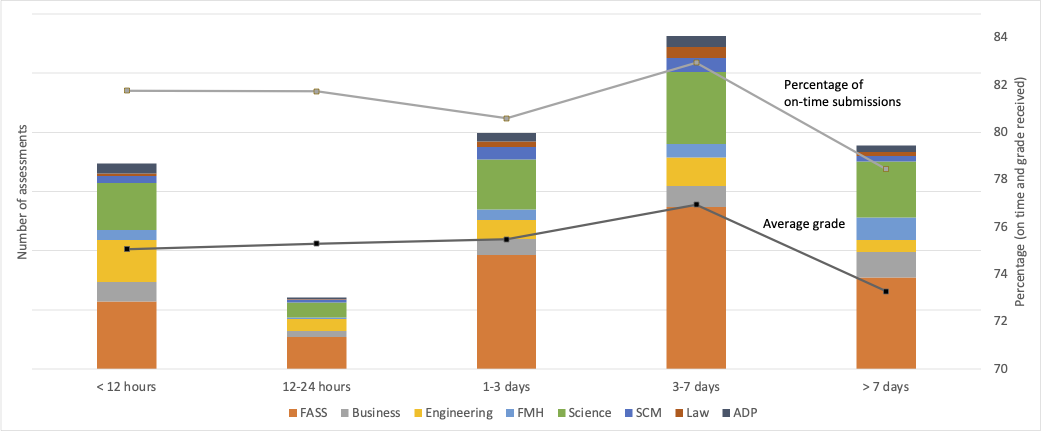
Figure 8 shows the proximity of assessment deadlines for the same students enrolled in different first year units, and its effect on the number of on-time submissions and the grades received. Given the popularity of midnight, Friday and Sunday deadlines, the first column is dominated by assessments with identical due times and the third column mainly represents assessments spaced out over the weekend. Grades and on-time submissions both appear to be maximised by deadlines which are spaced out by a week. Interestingly, both are poorest when students have longer gaps between deadlines, perhaps suggesting that continuous assessment plays a role in keeping students engaged.
Proportion of examinations to coursework
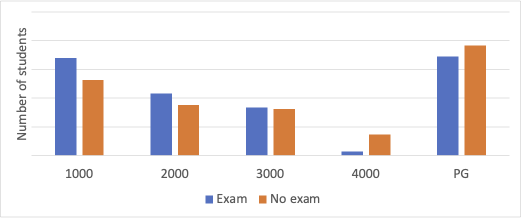
Around 1/4 of units have exams, rising to around 1/3 of first-year units. However, exams tend to be more extensively used in units with higher enrolments. As shown in Figure 9, just over 1/2 of enrolments are in units with exams and this increases to around 60% for first-year units. This reliance on examinations, particularly in Science, Engineering and Business, is also illustrated in Figures 4, 5 and 6 which show the relatively light weighting of assessment during semester and the heavy load in the formal exam period. As noted by
Tomas & Jessop (2019), this will affect students’ approach to learning and with most individual students sitting multiple exams over this period will, no doubt, reinforce a particular approach to study and cramming familiar from high school. Around 3/4 of these exams consist of either fully multiple choice questions or use a mixture of multiple choice and short answer questions.
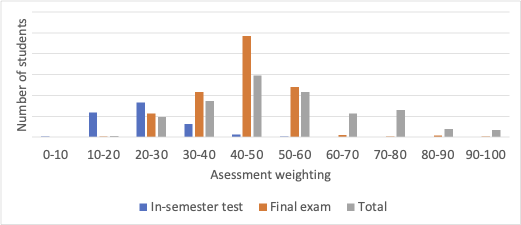
The median weighting of the final exam is 45%, and this is relatively independent of the level of study. Some units, particularly Business and Economics, also have an in-semester test which is also delivered under exam settings and is similar in style to the final exam. The median weighting of all exam-style assessments is 50% overall and 55% for first year units. Figure 10 shows the distribution weighting of exam-style assessments by student enrolment for units of study.
Number of different varieties of assessment
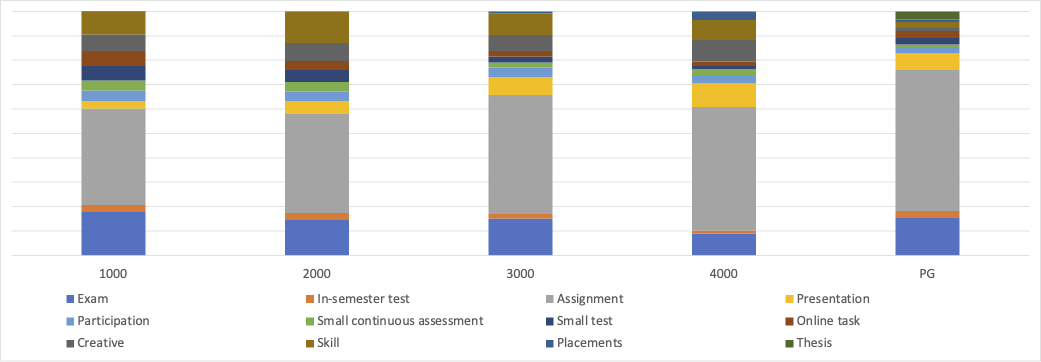
Assessments at the University of Sydney are organised into a defined set of assessment categories and types to inform students about what to expect in
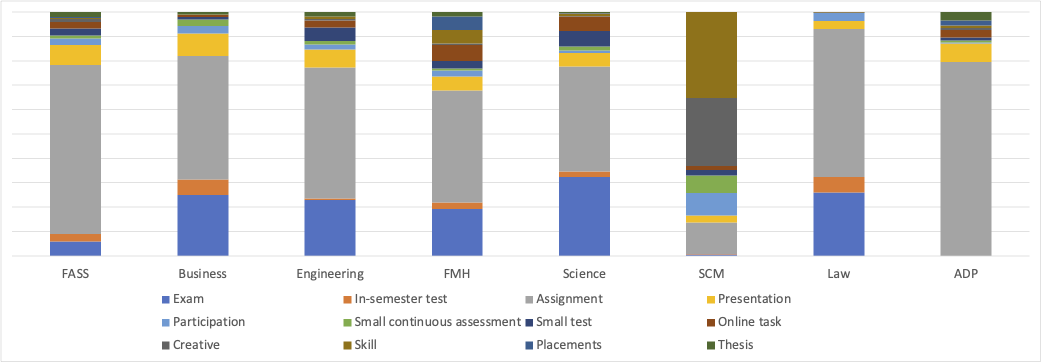
unit of study outlines, and to inform processes including academic plans for students living with a disability, special consideration and exam timetabling. Figures 11 and 12 show the relative weighting of these assessment types by level of study and by faculty/school respectively. Assignments dominate at each level and in every area except for the Sydney Conservatorium of Music (SCM) where creative and skill-based assessments are widely used. A full breakdown of assessments by category and type for the University and by faculty and University school is available as an appendix.
Again what does this mean for a ‘typical’ student? Figures 13, 14 and 15 show the different number of assessments, assessment types and relative weightings for the BSc, BA and BCom respectively for the most commonly chosen, semester 1 first-year units. The reliance on exams is again evident, with most students ending up with 3 or 4 high-weighted exams at the end of semester. Because of this, there are not many assessment types used with the majority of the remainder being assignments or small (mostly) online tests and tasks. At a programmatic level, students in the BA and BCom, in particular, will experience quite a variety of assessments. There are quite noticeably different expectations and assessment regimes, and this may add to the cognitive load experienced by these students in their first semester.
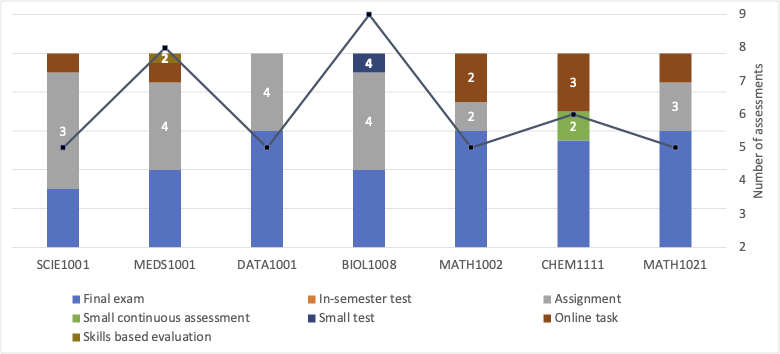
The line indicates the number of assessments in the units and the number labels show the number of assessments of that type when this is greater than 1.
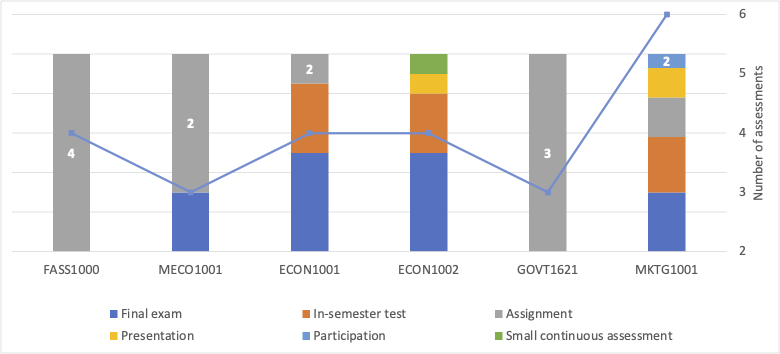
The line indicates the number of assessments in the units and the number labels show the number of assessments of that type when this is greater than 1.
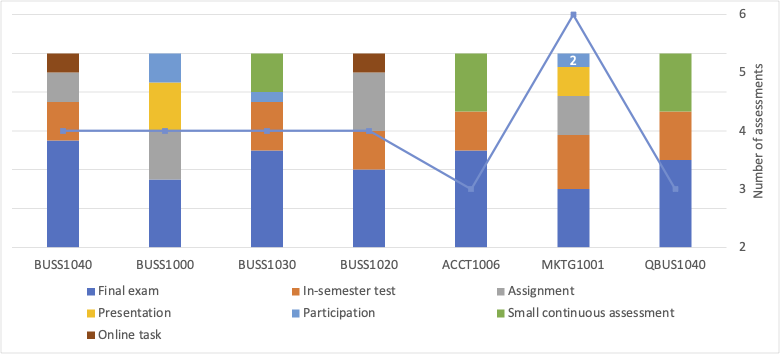
The line indicates the number of assessments in the units and the number labels show the number of assessments of that type when this is greater than 1.
Suggestions to reduce load
- ‘Programmatic’ approaches to assessment can help reduce the load for students and staff. Planning of assessment across sets of units with many students in common (e.g. in a major or in the first year of a degree) can ensure that dates and types of assessments are coherent at the program level. Alongside making sure that deadlines do not clash, it might be appropriate to limit the number of exams or to ensure that video assignments and group posters, for example, are not overused. To aid this process, information from the Knowing Your Students report (open to all staff) and unit outlines (on the internet) can be combined. The former lists the other units most commonly taken by the students in a unit. The latter can be used to get details on the assessments and deadlines in each of these units. Much of the data reported here has been obtained from these sources.
- Students love getting quick formative feedback on their progress through online quizzes and this can reduce the apparent load of summative assessment. Many people have generated sets of multiple-choice questions during the switch to online assessment and these can be used to provide formative quizzes using randomised banks of questions.
- Keep the number of summative tasks to 5 or fewer, including a small weekly task, and ensure that deadlines in the unit outline and its Canvas site match.
- Tweak your assessments to make them more authentic.
- Link assessment tasks together so that students can receive and act upon the feedback provided. Staging assessments, such as using a draft and final report, can reduce cognitive load for students and ensure that all the work providing feedback is not wasted.
- Consider cases where assessments can be marked during contact time, including replacing exams with interactive orals.
Tell me more
- Changes to assessment in 2023
- Further reading:
- Enrol in the
MPLF module 05 Assessment and feedback for learning
(next running in February 2023). - Enrol in the 2023 Unconference to get ideas from peers,
- Book a
consultation
for advice on how to re-design your assessment.