Just in time for the commencing semester, the widely popular report Knowing Your Students (KYS) has been given a facelift by Institutional Analytics and Planning (IAP) in collaboration with the Deputy Vice-Chancellor (Education) portfolio. The refresh is part of the IAP-run Analytics Modernisation Program (Amplify) that has overseen the transition of existing reports and development of new reports to the powerful and robust tool, Microsoft’s Power BI.
What has changed?
…the much-loved report [is] faster, more intuitive and streamlined…
The KYS report continues to provide its comprehensive description of your student cohort in each unit of study and allows for gaining deeper insights into your student make-up. What is different this time is the platform, which allows the much-loved report to be faster, more intuitive, and streamlined. KYS’s sister report, Knowing Your Unit (KYU) is also available within the same application.
As Power BI is Microsoft software, it is incorporated into your University license and does not require special access.
How do I access the report?
You’ll need to do a few things to complete one-time setup to get KYS and KYU showing in your Power BI ‘favourites’ list.
IAP has developed four bite-sized how-to videos for Power BI, which allow you to follow a step-by-step process on how to access the platform and learn of its core functionalities. Videos 1 and 2 are the main ones to watch to familiarise yourself with Power BI as well as add the KYS and KYU reports to your Power BI favourites.

You can access the KYS report through Power BI:
- Log in to Power BI using your unikey.
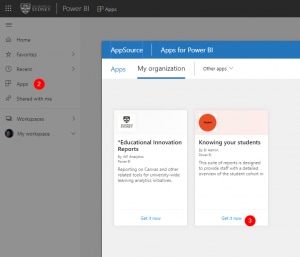
- In the left menu, click ‘Apps’. Then, click the ‘Get apps’ button.
- Look for the ‘Knowing your students’ tile, and click ‘Get it now’. Wait for it to load.
- Click into the app. To make it appear on your Power BI homepage, click the star icon to make it a favourite.
A detailed KYS user guide (PDF) has also been created that provides specific information on each of the charts used in the report.
Tell me more!
- To know more about what you can do with the report, here is an updated excerpt from another Teaching@Sydney article on the subject.
- For more information about the various analytics tools available for teachers, check out this page from the Education Portfolio.
- For further information on IAP and for technical support for KYS and KYU, please visit the web pages here.


5 Comments